In today's digital landscape, infographics are a powerful tool to simplify complex information. This article elucidates 10 crucial steps to create engaging infographics, starting from topic selection to evaluating effectiveness.
It provides a comprehensive guide on graphic design principles, color theory, and readability, ensuring your infographics stand out, captivate, and educate. Whether you're a novice or seasoned designer, these insights will pave the way for innovative and impactful visual communication.
Understanding the Importance of Infographics in Today's Digital World
While the digital landscape continues to evolve rapidly, it is increasingly essential to understand the importance of infographics as a powerful tool for communication and engagement in today's digital world.
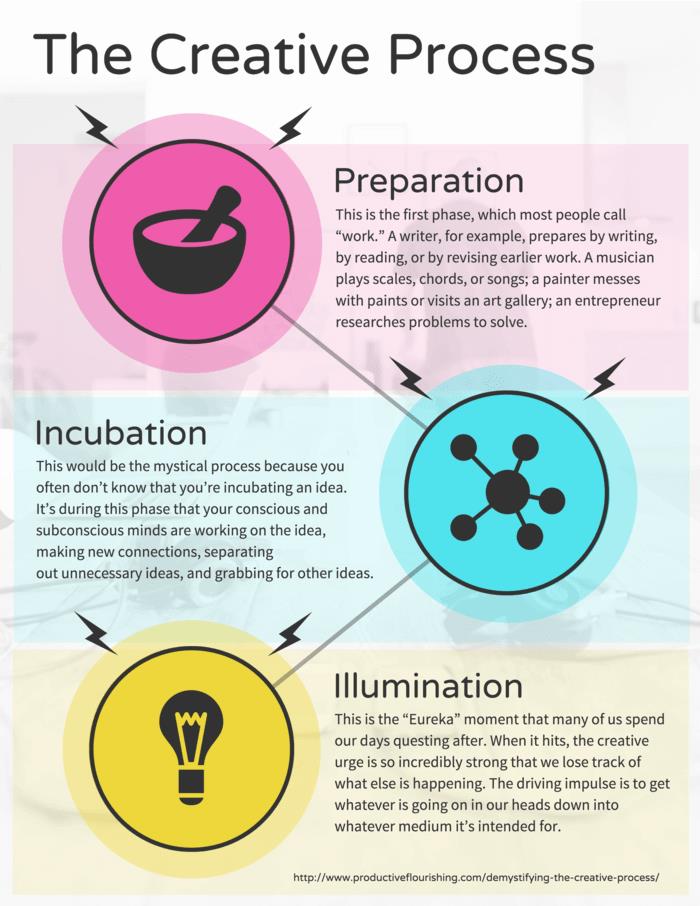
The infographic evolution has seen a steady growth, with a dynamic shift from plain text and numbers to captivating visuals and interactive elements. These graphical representations help to simplify complex information, thus catering to the visual literacy development of individuals.
They are a brilliant fusion of data and design, making information more appealing, digestible, and memorable. Infographics, when innovatively designed, can capture attention, increase comprehension, and prompt action, serving as a compelling medium for storytelling.
Therefore, mastering the art of infographics is crucial in the digital age to effectively communicate and engage with the audience.
Choosing the Right Topic for Your Infographic
Selecting an appropriate topic for your infographic is a pivotal step in the designing process, and it requires a thorough understanding of your audience's interests and needs. Conducting a meticulous Audience Analysis allows you to explore their preferences, thereby increasing Topic Relevance.
The key is to balance novelty with familiarity, choosing a topic that is innovative yet resonates with your audience. An engaging topic should ideally stimulate curiosity, be timely, and offer value.
Initiating Research and Gathering Relevant Data
Initiating comprehensive research and collating pertinent data form the backbone of creating a robust and informative infographic. The innovative process comprises the employment of data sourcing strategies to find relevant data, followed by analyzing research reliability to ensure accuracy.
Here are key steps to follow:
Implement a strategic approach to source data. This could involve mining databases, conducting surveys, or exploring academic journals.
Analyze the reliability of your findings. This demands cross-checking data sources or using statistical methods to verify results.
Use the gathered data creatively, weaving it into a compelling narrative.
The pursuit of this methodical approach ensures the creation of infographics that are not only visually appealing but also packed with trustworthy and relevant information. This is indispensable for designing engaging infographics.
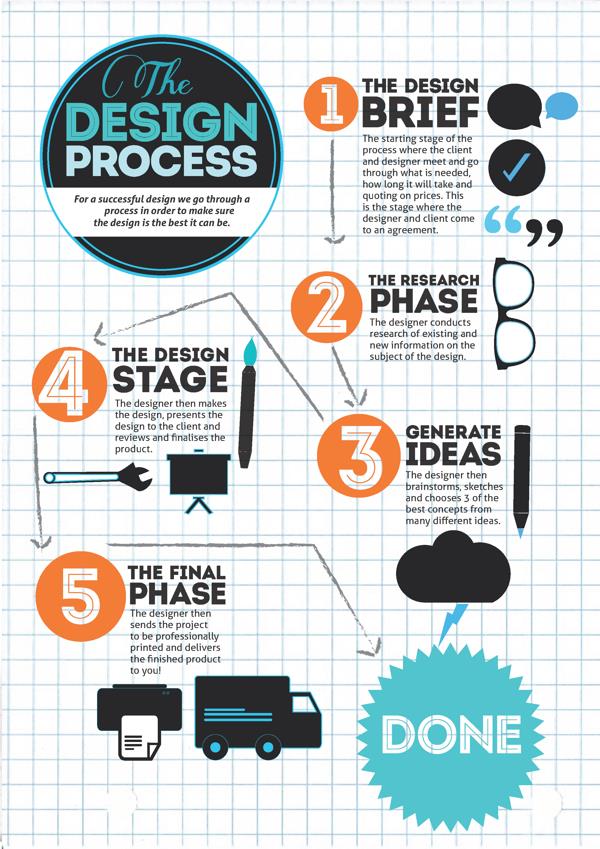
Structuring the Content for Optimum Engagement
Optimizing the structure of the content in an infographic is an essential step to ensure viewer engagement.
It is pivotal to consider the content hierarchy, create a satisfying visual flow, and utilize an engaging layout design.
These components work in unison to effectively communicate information and captivate the audience's attention.
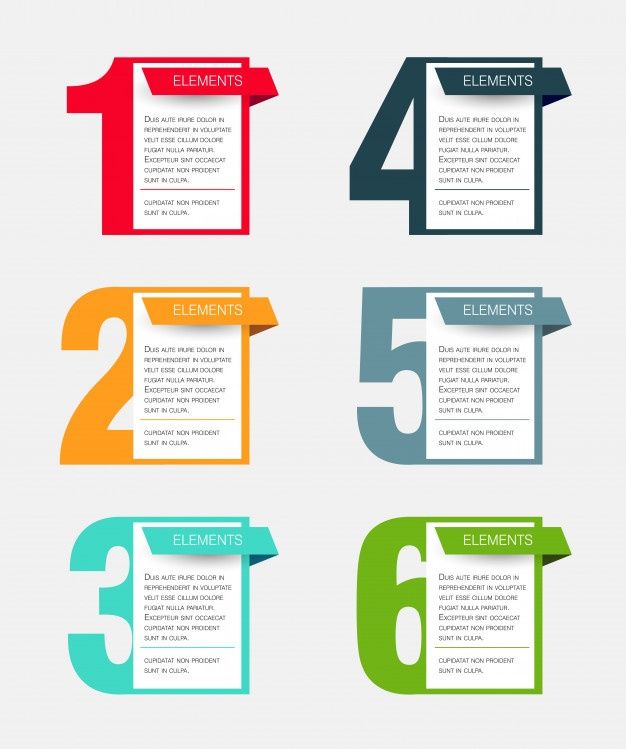
Content Hierarchy Importance
Understanding the importance of content hierarchy is crucial as it helps guide the viewer's attention in a manner that is both logical and engaging. With effective hierarchy placement, you can strategically lead your audience through the information, thus enhancing audience targeting.
In the realm of content hierarchy, consider the following:
Prioritize Information: Place the most important details at the top or in the center where they are most likely to be seen first.
Use Size and Color: Larger, brighter elements draw attention and should be used for key information.
Group Related Elements: This aids viewer understanding and helps to tell a coherent story.
In essence, a well-structured content hierarchy can significantly increase user engagement and comprehension, making your infographics more effective and impactful.
Visual Flow Considerations
In the process of creating compelling infographics, paying close attention to the visual flow, which is the pathway that the viewer's eye follows through the layout, is an absolutely essential step for ensuring maximum engagement and comprehension. This involves meticulous placement and sequencing of elements, to allow the viewer's gaze to naturally traverse the information without experiencing visual distractions.
Emphasizing flow consistency is vital to ensure the smooth transition from one point to another, thus aiding in the retention of the infographic's key messages. Avoid clutter and maintain a balance between text and images to minimize confusion.
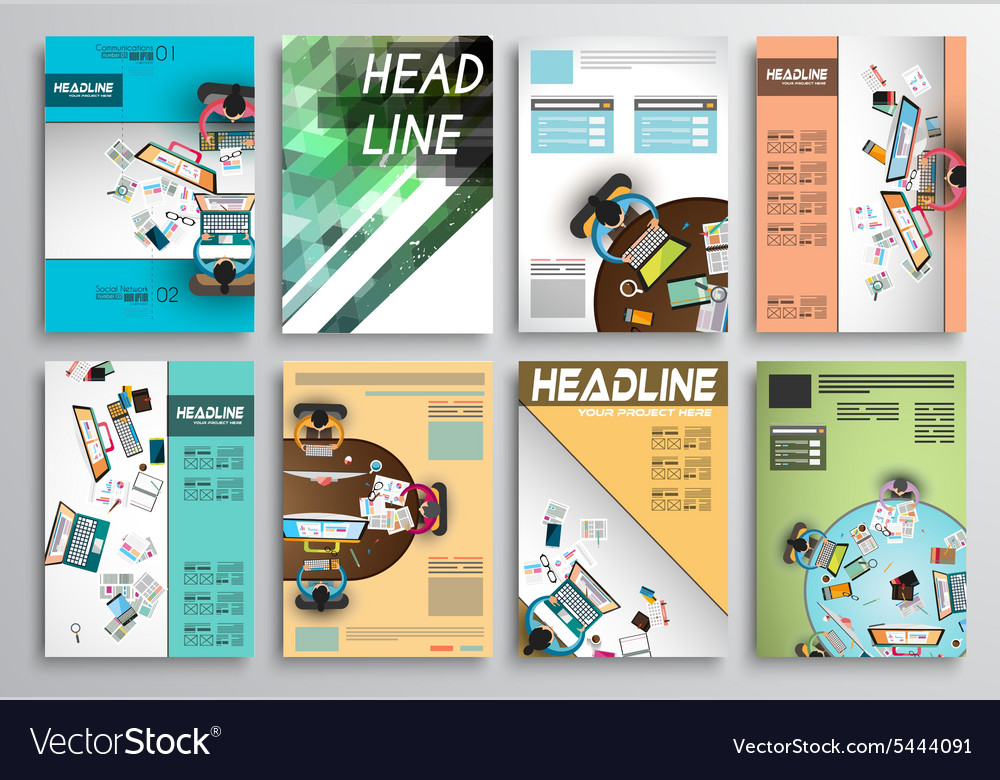
Engaging Layout Designs
Remarkably, the design and structure of your content can significantly influence the engagement level of your infographic, and it is therefore essential to carefully consider your layout choices. Leveraging design psychology and infographic typography, you can create an engaging layout design that effectively communicates your message while captivating your audience.
To achieve optimum engagement, consider the following key points:
- Strive for balance and harmony in your design. This can be achieved by evenly distributing elements across the layout.
- Make use of whitespace. This allows your content to breathe and aids in readability.
- Pay attention to typography. The right font can significantly enhance your infographic's visual appeal and readability.
Utilizing the Correct Graphic Design Principles
The effective use of the appropriate graphic design principles is a crucial aspect of creating engaging and visually appealing infographics. A designer must adhere to design ethics, ensuring that the infographic accurately and honestly represents the data it portrays. Misleading visuals not only jeopardize the designer's credibility but also invalidate the entire design process.
In addition, the use of advanced software tools can significantly enhance the quality and effectiveness of the infographic. Tools like Adobe Illustrator and Canva, for instance, provide a wealth of resources and functionalities that can make your infographic stand out.
Selecting and Implementing Visual Elements Effectively
In the realm of infographic design, the art of selecting and implementing visual elements effectively is a critical skillset. This process involves choosing visuals that not only align with your content, but also enhance comprehension and engagement.
We will explore strategies for effective element implementation, ensuring your infographics communicate your message with clarity and impact.
Choosing Relevant Visuals
Effective selection and implementation of visual elements is crucial in creating infographics that not only capture attention, but also convey complex information in an easily digestible format. Achieving visual consistency and ensuring image relevance are key aspects of this process.
To ensure the effective use of visuals, it is important to:
Align visuals with the overall theme of the infographic. Inconsistencies can confuse the audience and detract from the main message.
Select images that directly relate to the content. Irrelevant images can distract the reader and dilute the impact of the information being presented.
Incorporate innovative visual elements that can add value to the infographic. These can include charts, graphs, and icons that not only look appealing but also simplify complex data.
Effective Element Implementation
Undoubtedly, selecting the right visual elements for your infographic is only half the battle, for it is their effective implementation that truly brings your message to life. Embracing element diversity in your designs can enrich the visual narrative, while smart use of infographic symbolism can communicate complex ideas effortlessly.
However, these elements must be deployed with an expert hand. Too many diverse elements can overwhelm the viewer, just as a poorly chosen symbol can confuse or mislead. Balance is key, as is a keen understanding of your audience's visual literacy.
For instance, a tech-savvy demographic might appreciate innovative, abstract symbols, whereas a more conventional audience may prefer familiar, easily recognizable imagery. Therefore, effective element implementation is about striking the perfect balance between innovation, clarity, and audience understanding.
The Role of Color Theory in Infographic Design
Color theory, a fundamental component of graphic design, plays an indispensable role in creating visually compelling and impactful infographics. It utilizes aspects of color psychology and careful hue selection to create designs that not only engage the viewer's attention but also help convey the intended message effectively.
Color psychology: The study of how colors can influence human behavior and emotions. For instance, red can evoke feelings of urgency, while blue is often associated with trust and stability.
Hue selection: The choice of colors used in an infographic. The right hues can enhance understanding and retention of information.
Color harmony: The arrangement of colors in a way that is aesthetically pleasing to the eye.
Understanding and applying color theory can greatly enhance the effectiveness and engagement of your infographic designs.
Making Your Infographic Mobile-Friendly: Why and How
With over half of global web traffic generated through mobile phones, and the increasing trend of consuming information on-the-go, it is vital to design infographics that are not only visually engaging but also optimized for mobile viewing. Taking into account mobile optimization strategies is an innovative approach that ensures your content reaches a wider audience. This step is often overlooked, but its importance cannot be overstated.
The responsive design importance lies in its ability to adjust to different screen sizes, providing an optimal viewing experience for all users. By employing a detail-oriented design process, you can create infographics that maintain their aesthetic appeal while being accessible and enjoyable to view on mobile devices.
This is the future of infographic design.
Ensuring Readability and Accessibility in Your Infographic
Readability and accessibility are pivotal factors in infographic design, and they play a significant role in ensuring that your visual content effectively communicates the intended message to a broad audience. The importance of font selection and text size considerations cannot be overstated in this aspect.
Font selection importance: The choice of font can dramatically affect the readability of your infographic. Opt for clean, simple fonts that are easy to read, ensuring your message is effectively conveyed.

Text size considerations: The size of your text should be large enough to be easily read, but not so large that it overwhelms the design.
Use of contrast: Make use of contrasting colors for text and background to enhance readability.
Evaluating the Effectiveness of Your Infographic: Key Metrics to Consider
After ensuring the design and readability of your infographic, it is crucial to consider the effectiveness of your creation by evaluating some key metrics. These metrics, integral to conversion rate optimization, offer a snapshot of your infographic's impact. They provide tangible evidence of its success or areas for improvement.
Infographic promotion strategies should always include a method for measuring engagement. Look for metrics such as the number of views, shares or likes, and the time spent by viewers on your infographic. These indicators can illuminate your creation's reach and engagement level.
Moreover, conversion rates are pivotal. They reveal how many viewers took the desired action after viewing your infographic, such as signing up for a service or purchasing a product. This data is invaluable for assessing the return on your creative investment.
Frequently Asked Questions
For creating engaging infographics, software tools like Adobe Illustrator, Canva, and Visme are highly recommended. These offer diverse software features comparison and extensive infographic templates utilization, fostering innovation in design execution.
How Can I Incorporate My Brand Identity Into the Infographic Design?
To incorporate your brand identity into infographic design, maintain color consistency throughout to reflect your brand's palette. Additionally, strategic logo placement can subtly yet effectively enhance brand recognition and ensure a cohesive look.
How Much Time Does It Typically Take to Design an Effective Infographic?
The duration for designing an effective infographic varies. It depends on complexity and designer expertise. However, with proper time management techniques, it typically ranges from a few hours to several days. Outsourcing can expedite the process.
Are There Any Specific Copyright Laws I Need to Be Aware of When Creating Infographics?
Yes, copyright laws are critical when creating infographics. Be mindful to avoid copyright infringements and adhere to the fair use policy. Ensure all images, data, or information used are appropriately licensed or credited.
How Can I Use Infographics as Part of a Larger Marketing Strategy?
Infographics can be strategically integrated into marketing campaigns for improved SEO. They are also ideal for sharing on social media platforms, providing visually appealing content that can drive engagement and increase brand visibility.
 Digital Art InstructionDIY Infographics DesignMobile Game ArtworkPersonalized Logo Design3D AnimationeBook Covers DesignPrivacy PolicyTerms And Conditions