In an era dominated by visual content, mastering infographic marketing strategies is vital. This article presents ten essential components to enhance your infographic marketing mastery.
We delve into understanding audience preferences, crafting compelling narratives, data selection, design aesthetics, SEO optimization, effective promotion, success metrics, and illustrative case studies.
Engage with our data-driven insights to innovate your marketing approach and amplify your brand's digital presence.
Understanding the Role of Infographics in Digital Marketing
Undeniably, understanding the role of infographics in digital marketing is a critical aspect of mastering infographic marketing strategies.
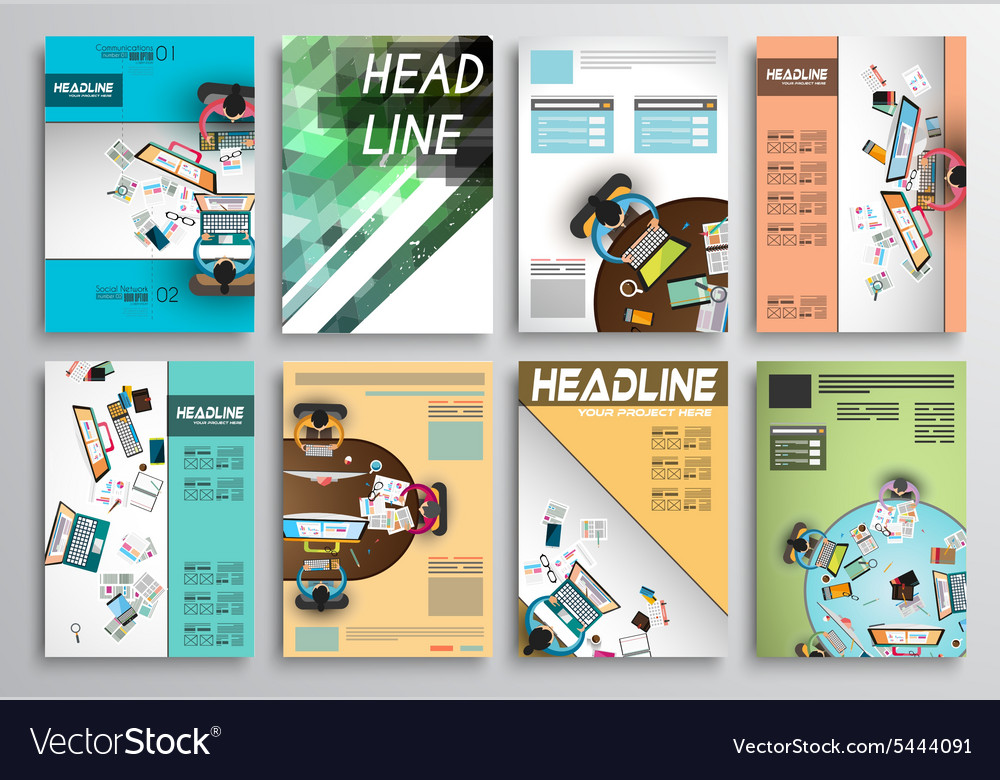
Infographics provide a host of advantages, including the ability to effectively convey complex data in a visually engaging, easily digestible format. This enhances comprehension and retention of information, fostering more meaningful interactions between businesses and their target audience. Moreover, the visual nature of infographics stimulates viewers' curiosity, encouraging further exploration and engagement with the brand.
However, there are limitations to infographics. Despite their efficiency in data visualization, they may oversimplify information, leading to potential misunderstandings. Additionally, designing high-quality infographics can be time-consuming and expensive.
Therefore, it is crucial to strike a balance between leveraging infographic advantages and mitigating their limitations to optimize digital marketing performance.
Deciphering Your Target Audience's Preferences
A fundamental step in refining your infographic marketing strategy involves accurately deciphering the preferences and needs of your target audience. Achieving this requires an innovative approach to audience segmentation, leveraging data to understand their unique behaviors, desires, and pain points.
By segmenting your audience, you're not only tailoring your content but also personalizing your interactions with them.
Content personalization, in turn, is a powerful tool that caters directly to your audience's preferences. It involves crafting infographics that resonate with their interests and challenges, driving engagement and conversions. Remember, the goal is to create a connection, not just a transaction.
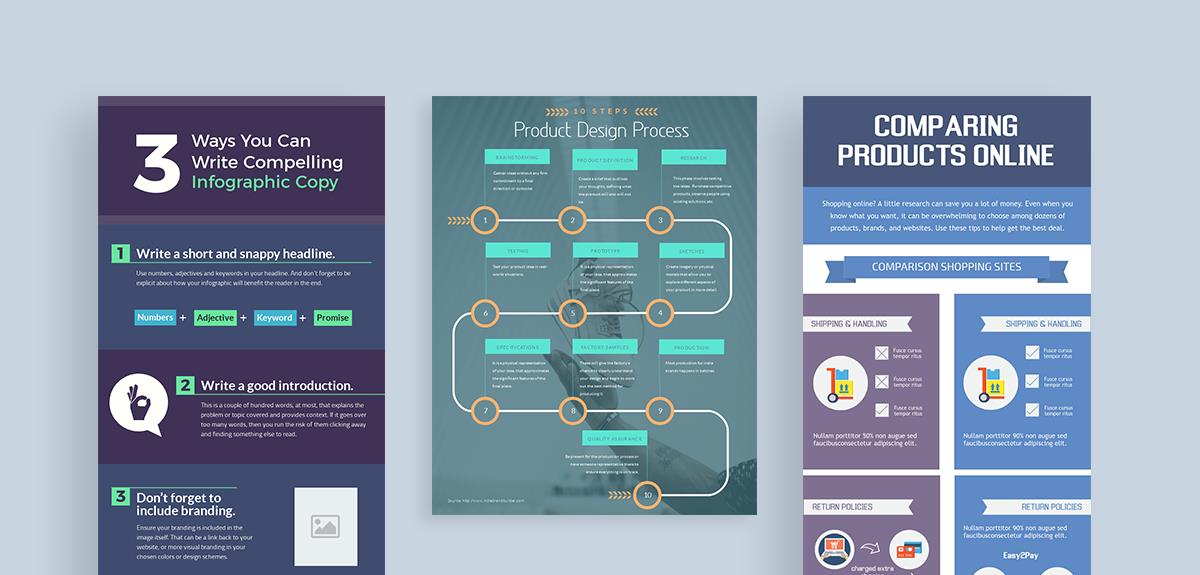
Crafting a Compelling Narrative for Your Infographics
Creating an engaging narrative for your infographics is not just about design, but about telling a story that resonates with your audience. A well-structured narrative and effective visual storytelling can significantly enhance the impact of your infographic, making it more memorable and easier to comprehend.
Let's explore the importance of narrative structure and master some techniques for visual storytelling in infographics.
Narrative Structure Importance
The success of an infographic greatly hinges on the quality of its narrative structure, which guides the viewer through the information in an engaging and understandable manner. Narrative consistency and audience engagement are critical aspects of this structure.
Narrative consistency ensures that the infographic tells a cohesive story, keeping the viewer engaged from the beginning to the end.
Audience engagement is achieved when the infographic resonates with the viewer and prompts them to interact with your brand.
Data visualization is key to presenting complex information in an easily digestible format.
Innovation in design and content execution can set your infographic apart in a saturated digital landscape.
Ultimately, a compelling narrative structure can significantly enhance the effectiveness of your infographic marketing strategy.
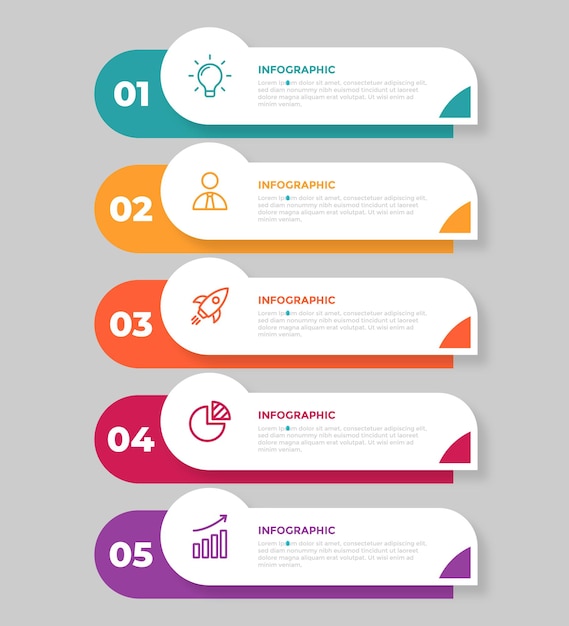
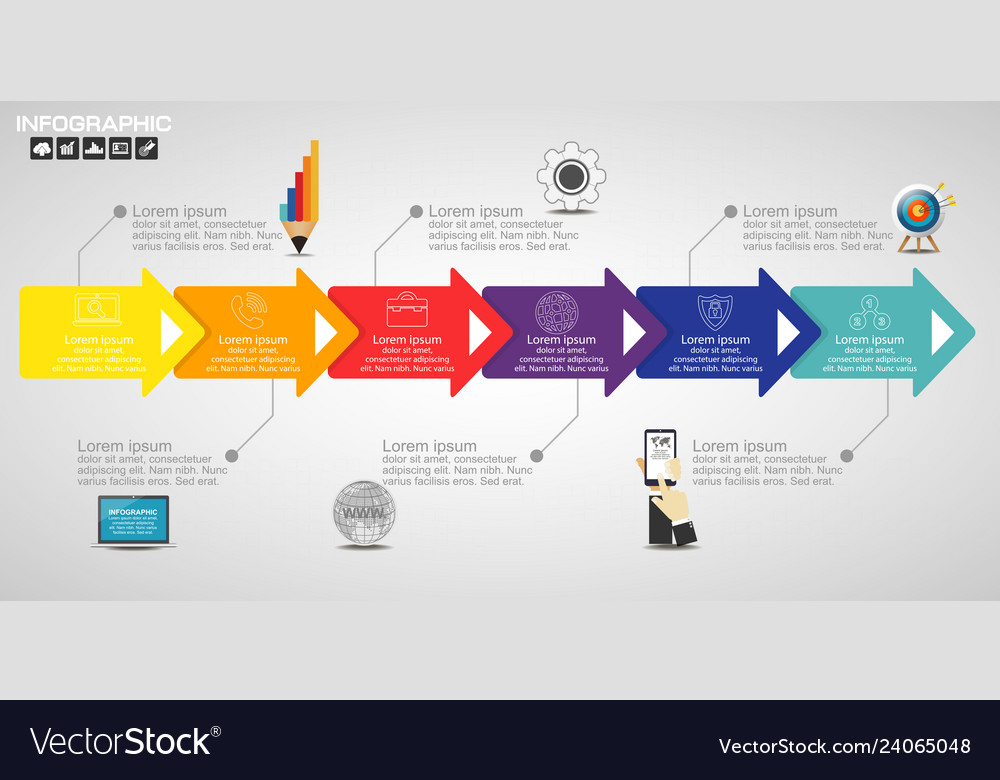
Visual Storytelling Techniques
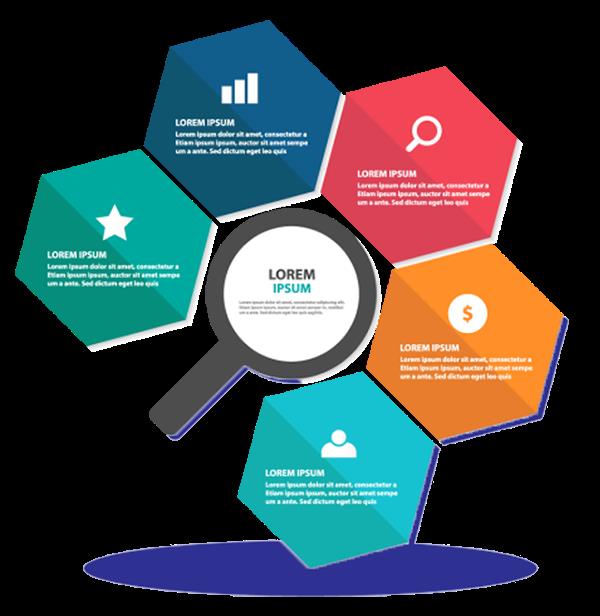
Mastering visual storytelling techniques is fundamental to crafting a compelling narrative for your infographics, helping to capture and maintain a viewer's attention. Innovative icon usage is critical in this regard; wisely chosen and placed icons can quickly convey complex information. The right icons can serve as visual shortcuts, giving viewers an immediate understanding of your content, thus enhancing the overall narrative.
Moreover, to truly captivate your audience, consider the power of infographic interactivity. Interactive elements invite viewers to engage with the data in a dynamic way, encouraging exploration and discovery. This interactivity transforms your infographic from a static image into an immersive, data-driven experience.
Hence, infusing a compelling narrative with strategic icon usage and interactive elements is key to mastering infographic marketing.
Choosing the Right Data for Your Infographic
Before delving into the design elements of your infographic, it's crucial to zero in on the most appropriate and impactful data to present. The data's credibility and the infographic's personalization both play vital roles in delivering an engaging narrative.
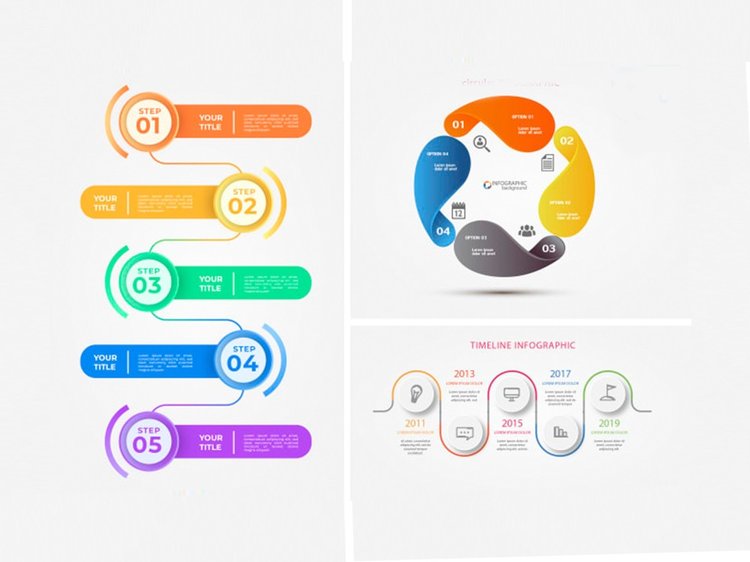
Identify Relevant Data: Choose data that aligns with your message, target audience, and goals.
Ensure Data Credibility: Verify your data sources for accuracy and reliability.
Infographic Personalization: Tailor your data to resonate with the audience's experiences and interests.
Simplify Complex Data: Break down complex data sets into digestible, visually compelling components.
The Art of Infographic Design: Balancing Aesthetics and Clarity
Mastering the art of infographic design necessitates a fine balance between compelling aesthetics and clear, concise data representation.
Striking this balance involves the application of design principles that ensure aesthetics enhance rather than obscure the message.
Let's explore how the interplay of effective aesthetics and clarity can lead to a successful infographic marketing strategy.
Design Principles Application
Applying design principles effectively in infographic creation is an art that requires a delicate balance between aesthetics and clarity. It's not just about using sophisticated infographic software, but understanding the core principles of design to bring out the best in your data.
This can be achieved by drawing design inspiration from various sources and applying it creatively.
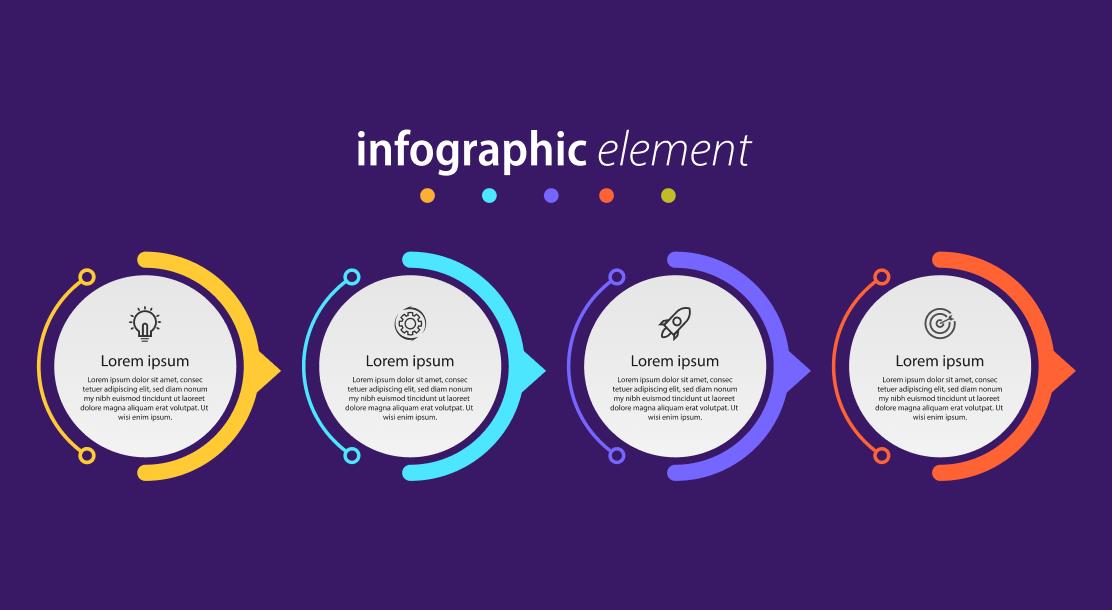
Use of Colors: Colors should be used strategically to highlight key information and guide the viewer's eye.
Typography: The font size and type should enhance readability and comprehension.
Simplicity: The design should be simple, clean, and concise to avoid information overload.
Hierarchy: The most important data should be visually prominent.
Mastering these principles can lead to infographics that are both visually pleasing and effective in conveying information.
Balancing Beauty and Clarity
An infographic's effectiveness hinges on its designer's ability to balance beauty and clarity, ensuring that the data's visual representation is not only aesthetically appealing but also easily understood by the viewer.
This is where the art of infographic design comes in, harmonizing design simplicity with image optimization.
Design simplicity aids in maintaining visual clarity, while image optimization enhances aesthetic appeal without compromising loading times. The goal is to create an infographic that is engaging and quick to load, while still being visually stunning.
By striking a balance, the infographic becomes an effective tool for conveying complex data in a digestible manner.
Thus, the art of infographic design is a critical component in mastering infographic marketing strategies, pushing the boundaries of innovation and effective communication.
Effective Infographic Aesthetics
Delving into the realm of effective infographic aesthetics, the challenge lies in maintaining a delicate equilibrium between captivating design and precise, clear data representation.
To master this art, it is important to consider:
Infographic Dimensions: The size and shape of your infographic should be suitable for the platform you're using. The ideal dimensions facilitate readability and enhance visual appeal.
Pictorial Symbolism: The use of icons and symbols should be purposeful, enhancing understanding of the information presented.
Color Scheme: A carefully chosen palette can guide the viewer's attention, making the data easier to digest.
Typography: The font style and size should complement the design, without compromising on readability.
Innovation in design, when harmonized with clarity, results in infographics that are not only aesthetically pleasing but also effective in conveying data.
Using Colors and Fonts Effectively in Infographics
The strategic use of colors and fonts in infographics forms a crucial aspect of successful infographic marketing strategies.
An understanding of color psychology is key; different colors evoke different emotions, playing a significant role in influencing user behavior and decision-making. For instance, blue often symbolizes trust and reliability, while red can stimulate urgency.
Equally important is font readability; complex fonts can cause confusion and may detract from the message. Instead, opt for clear, legible fonts that enhance comprehension.
Combining thoughtful color schemes with appropriate fonts can significantly improve engagement and retention, driving your infographic's effectiveness.
Essentially, the right blend of colors and fonts can turn your infographic from a simple visual tool into a powerful marketing instrument.
Optimizing Your Infographics for Search Engines
Harnessing the power of SEO, optimizing your infographics for search engines is a critical step that can significantly enhance your infographic marketing strategy's visibility and reach. This optimization is not just about creating engaging visuals; it's about ensuring that these visuals are discoverable and indexable by search engines.
Here are some innovative strategies:
Keyword Integration: Incorporate relevant keywords into your infographic's title, description, and metadata. This increases the chances of your infographic appearing in relevant search results.
Alt Text Utilization: Use alt text to describe your infographic. This helps search engines understand the content of your image.
Link Building: Embed shareable links in your infographic to improve its search engine rankings.
File Size Optimization: Keep your infographic's file size small to ensure quick loading times, which can improve SEO rankings.
These steps will maximize your infographic's potential in the digital landscape.
After creating and optimizing your infographic, one must not only focus on the design aspect but also strategize on how to effectively promote it across various platforms. Intelligent platform selection is crucial to reaching your target audience. Opt for platforms where your audience is most active and your infographic is most likely to be shared. Remember, the goal of infographic distribution is to maximize visibility and engagement.
Use data-driven strategies to identify these platforms and outline a schedule for distribution. Innovation is key when promoting your infographic. Consider email marketing, social media posts, blog posts, and even paid promotions. Track your results continuously to tweak your strategy for improved reach and engagement.
Effective promotion can significantly augment the power of your infographics.
Measuring the Success of Your Infographic Marketing
While the creation and promotion of your infographics are undoubtedly crucial, it is essential to measure their performance to evaluate the success of your infographic marketing strategy. This is where Infographic KPIs and Conversion tracking come into play.
Here are four primary metrics to evaluate:
Engagement metrics: This includes likes, shares, and comments that your infographic receives. High engagement indicates resonating content.
Traffic Sources: Identify which platforms are driving the most traffic to your infographic. This helps in optimizing your promotional efforts.
Conversion tracking: Monitor how many leads or sales your infographic is generating. This reflects the direct ROI of your infographic.
Audience Retention: Measure how long your audience spends on your infographic. This indicates how engaging and effective your infographic is.
Case Studies: Successful Infographic Marketing Campaigns
To further understand the intricacies of infographic marketing strategies, let's turn our attention to real-world instances of successful campaigns. By analyzing specific case studies, we can glean significant insights, pinpointing what worked and why.

These actionable lessons serve as invaluable guides for shaping and refining our own infographic marketing strategies.
Campaign Analysis
In the realm of infographic marketing, understanding the nuances of successful campaigns can provide valuable insights for future strategies. A data-driven analysis of these campaigns can assist in optimizing campaign budgeting and infographic distribution.
Campaign Budgeting: By studying the budget allocation of successful campaigns, we can discern the most cost-effective strategies. This could involve investment in infographic creation or distribution channels.
Infographic Distribution: A thorough examination of successful campaigns can reveal the most effective channels for infographic distribution, be it social media, email, or websites.
Engagement Metrics: Successful campaigns often have high engagement rates. Analyzing these metrics can help identify what resonates with your audience.
Conversion Rates: This final analysis point can provide insights into the direct impact of infographics on customer behavior, helping to shape more successful future strategies.
Lessons Learned
We have dissected several successful infographic marketing campaigns and, through these case studies, we can now share some invaluable lessons learned.
Firstly, infographics, while visually compelling, have limitations. The data must be concise and well-structured to avoid overwhelming the viewer. Overcomplicating the design can lead to a loss of focus on the core message.
Secondly, one of the common marketing pitfalls is neglecting to align the infographic with the brand's identity. Consistent branding is key to building credibility and recognition.
Lastly, successful campaigns employ a strategic dissemination plan. Merely creating the infographic is not enough - it needs to be seen by the right audience at the right time. This involves leveraging multiple channels, including social media, blogs, and email newsletters, to maximize its reach and impact.
Frequently Asked Questions
What Are the Potential Challenges in Developing Infographic Marketing Strategies?
Potential challenges in infographic marketing strategies include designing complexity, which can hinder message clarity, and efficient infographic distribution to reach the targeted audience, which requires innovative and data-driven planning and execution.
How Can I Ensure My Infographic Remains Relevant Over Time?
To ensure your infographic remains relevant over time, regular content refreshment and visual updates are crucial. Stay informed about current trends, data, and audience preferences to consistently deliver innovative and engaging infographic content.
Are There Any Legal Considerations to Take Into Account When Using Data for Infographics?
Certainly, legal considerations such as data copyright and plagiarism prevention are crucial when using data for infographics. Always ensure data sources are credible, permissions are obtained, and proper attributions are made to avoid copyright infringements.
How Can Infographics Be Integrated Into an Existing Marketing Strategy?
Infographics can be integrated into an existing marketing strategy by applying infographic design principles to create compelling visuals, then leveraging various infographic distribution channels to reach target audience and drive engagement.
For crafting professional infographics, tools like Canva, Piktochart, and Adobe Illustrator are highly recommended. These offer flexibility in applying color psychology and ensure adherence to infographic accessibility standards, fostering innovation in visual data communication.
 Digital Art InstructionDIY Infographics DesignMobile Game ArtworkPersonalized Logo Design3D AnimationeBook Covers DesignPrivacy PolicyTerms And Conditions