In an era where data reigns supreme, interactive infographics have emerged as a powerful tool to engage users on social media. This article reveals ten innovative strategies to boost user participation, from aesthetic considerations to storytelling techniques.
Through insightful case studies and data-driven analysis, we illuminate the potential of interactive infographics, addressing challenges and forecasting future trends.
Join us as we explore the transformative power of these compelling visuals in the social media landscape.
Understanding the Power of Interactive Infographics
In our journey to boost user participation, it's crucial that we fully grasp the power of interactive infographics and their role in engaging audiences on social media.
Infographic interactivity taps into user psychology, stimulating curiosity and encouraging active engagement. It's an innovative approach that promotes not just the consumption but also the interactivity of content.
The allure of visually appealing data, coupled with the ability to manipulate and explore it, piques the interest of users. It prompts them to delve deeper, fostering a connection with the information being presented.
This, in turn, boosts participation rates and enhances user retention. Thus, by leveraging the power of interactive infographics, we can transform passive observers into active participants, thereby revolutionizing the way we communicate data on social media platforms.
The Role of Visual Aesthetics in User Engagement
Visual aesthetics, a critical component in user engagement, offer more than just surface-level appeal, but also play a significant role in capturing attention and facilitating user interaction on social media platforms.
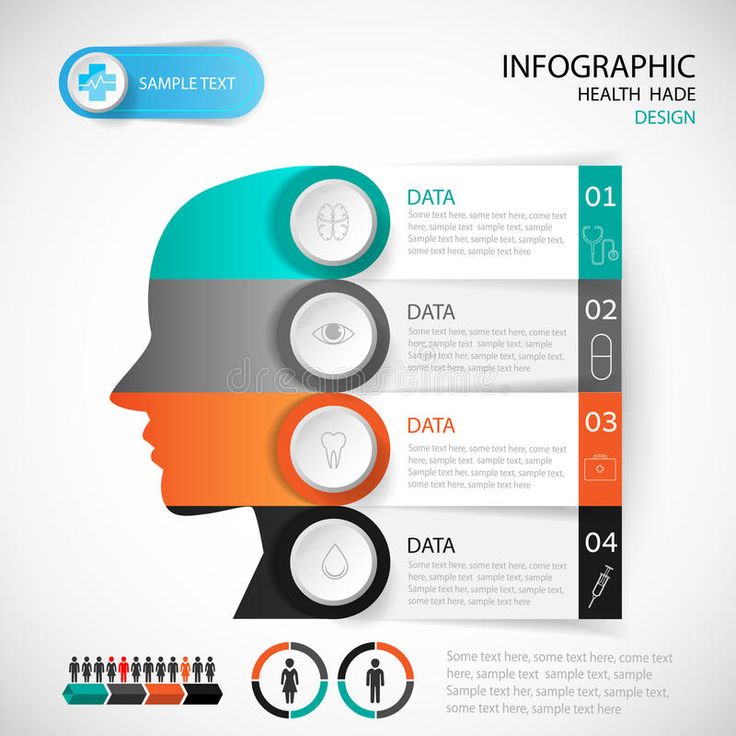
The impact of visual aesthetics on user engagement can be quantified in three key areas:
Color Psychology: Users psychologically respond to different colors, which can influence their interactions and engagement levels. For example, red often evokes strong emotions while blue stimulates a sense of trust.
Visual Perception: Elements like size, shape, and orientation can guide users' eyes and attention, thereby facilitating user interaction with the content.
Design Quality: High-quality design can increase perceived value, thereby boosting user engagement.
Techniques for Simplifying Complex Data
The art of simplifying complex data hinges on two key points:
- Effective data visualization strategies
- Engaging infographic design
Harnessing the power of these elements can transform a maze of information into an appealing, easily digestible visual.
Let's shift our focus on how to master these techniques, and in turn, enhance user participation on social media.
Data Visualisation Strategies
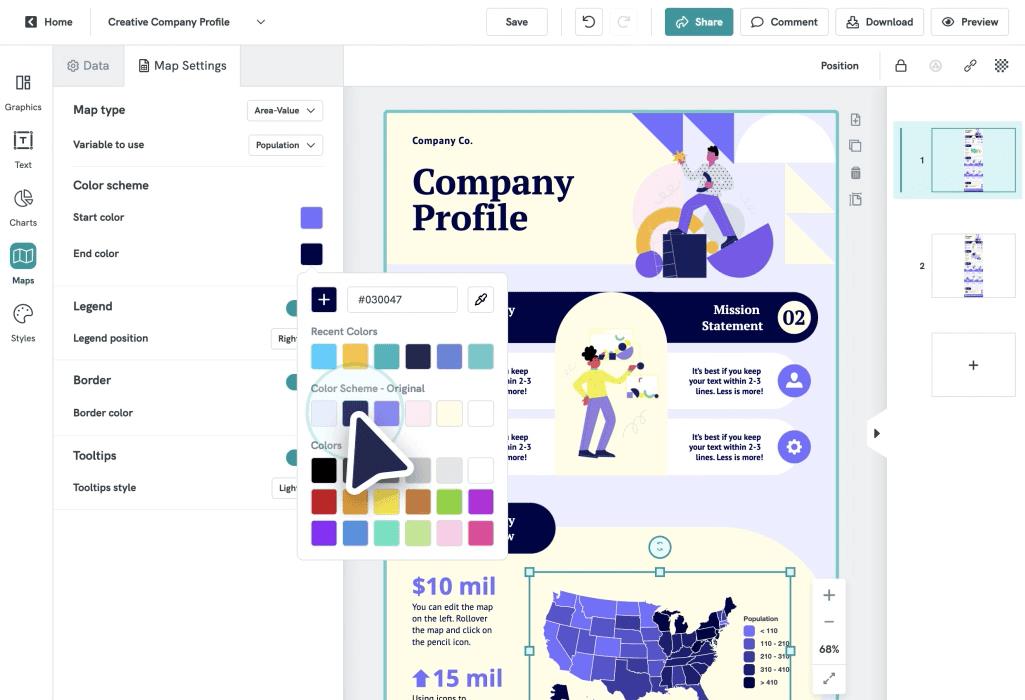
Understanding and employing effective data visualisation strategies can profoundly simplify the presentation and interpretation of complex information. To achieve this, visual literacy and the right infographic software are crucial.
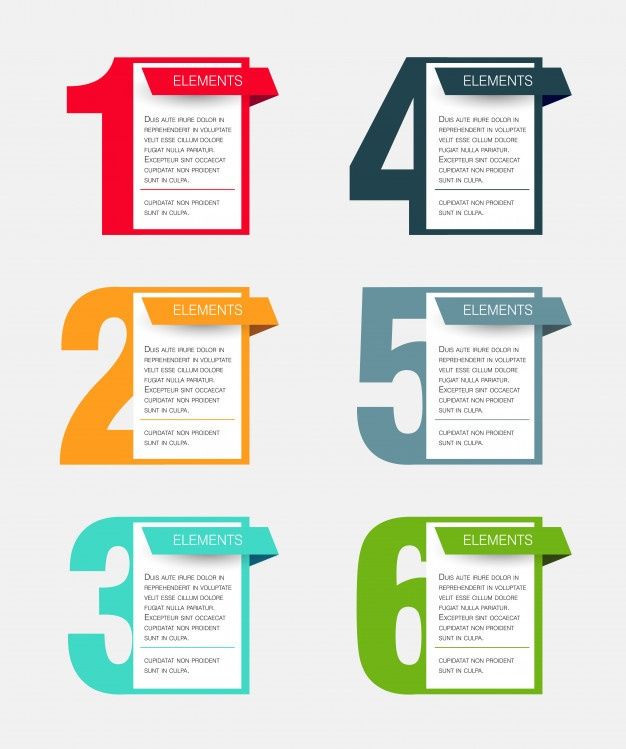
Use Hierarchies: Organize data in a hierarchical manner to guide user understanding. This technique helps in breaking down complex data into simple, consumable chunks.
Interactive Infographics: Use infographic software to create interactive infographics. They not only provide an engaging experience but also allow users to explore data at their own pace.
Utilize Color Schemes: Different colors can convey various data types and levels of information. They help users in distinguishing between different data points.
Innovation in data visualisation strategies can significantly enhance user participation and engagement on social media platforms.
Effective Infographic Design
A significant number of research studies reveal that simplifying complex data through effective infographic design techniques can substantially increase user participation on social media platforms. This process involves distilling data into easily digestible visual representations, utilizing elements of color psychology and strategic font selection.

Color psychology plays a key role in capturing attention and eliciting emotional responses. Warm colors, for instance, can stimulate activity, while cool colors promote calmness. Conversely, font selection impacts readability and comprehension, thus affecting the user's overall engagement.
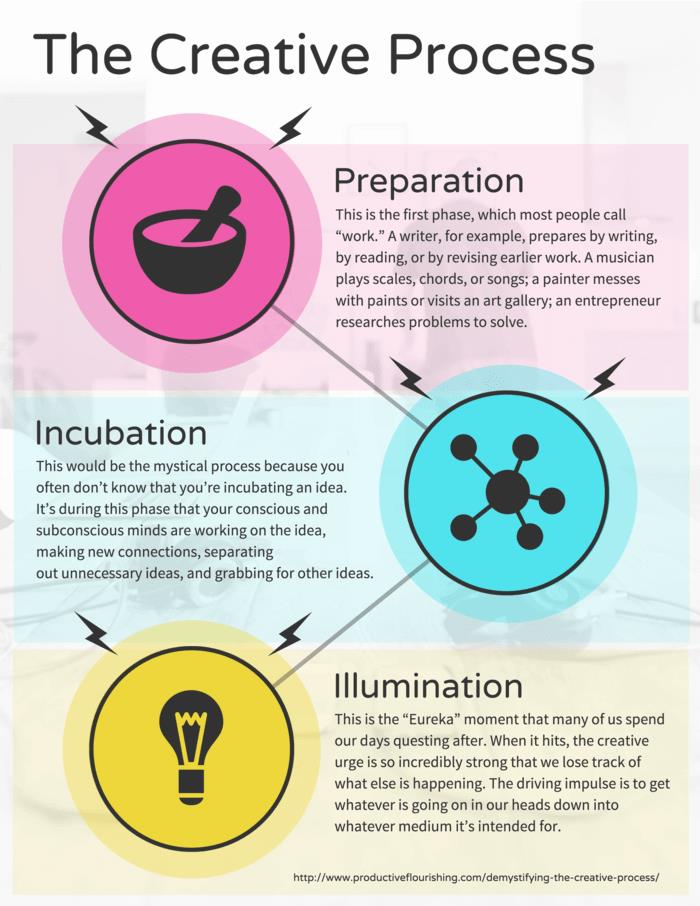
The Art of Storytelling Through Infographics
Harnessing the power of visual communication, storytelling through infographics has emerged as an effective strategy for engaging social media audiences. The narrative flow importance and infographic character usage are key to creating compelling stories with infographics.
Narrative Flow: Storytelling relies on a consistent, logical progression. This means your infographic should guide the viewer through the information in a way that makes sense, building anticipation and interest.
Character Usage: Infographic characters are powerful tools that can help humanize data and make it more relatable. They can represent user personas, illustrate behaviors, or symbolize data points.
Engagement: A well-structured narrative with relatable characters will increase user engagement, fostering a deeper connection with your content.
This innovative approach to infographic design is transforming the way businesses communicate their stories on social media.
Several social media platforms offer unique features that, when leveraged effectively, can significantly enhance the sharing and visibility of your interactive infographics.
For example, Facebook's built-in share functionality can be used to spread your infographic across diverse networks.
Instagram's multiple image feature can be used to share different segments of your infographic and spark curiosity.
Twitter's hashtags can be used to increase visibility among specific interest groups.
By incorporating these features into your infographic optimization strategy, you can stimulate content virality.
Consequently, making use of these unique social media features can result in a broader reach and higher user engagement.
Remember, the key is to understand and use each platform's special features to your advantage.
Innovation starts with an in-depth understanding of your resources.
Strategies for Encouraging User Interactivity
Drawing on proven methods, we will now delve into strategies that can effectively encourage user interactivity with your infographics on social media platforms.
Key among these are incentive schemes and gamification strategies.
Incentive Schemes: Rewarding users for their engagement can spur their interest and participation. Offering exclusive content, discounts, or tangible rewards for sharing or interacting with your infographics can significantly boost user participation.
Gamification Strategies: Transforming the interaction into a game-like experience can enhance user engagement. Leaderboards, badges, or points for interacting can add a fun, competitive edge.
User-centric Design: Lastly, making the infographic user-centric, intuitive and interactive can significantly amplify user engagement.
Measuring the Impact of Interactive Infographics on User Participation
Understanding the influence of interactive infographics on user participation necessitates a systematic and data-driven approach.
Evaluating the effectiveness of this method is crucial, considering areas such as impact analysis methods, and the rate of participation increase.
Impact Analysis Methods
The effectiveness of interactive infographics in influencing user participation can be assessed using a variety of impact analysis methods. These methods include comparing different methodologies, analyzing offline applications, and using metrics that track user engagement.
Methodology Comparison: Comparing different methodologies can provide insights into which types of infographics are most effective at driving user participation.
Offline Applications: Assessing the impact of infographics in offline applications can provide unique insights into their overall effectiveness.
User Engagement Metrics: These metrics track how users interact with infographics, providing vital data on their engagement levels.
These impact analysis methods can provide valuable insights into the effectiveness of interactive infographics, aiding in the development of more engaging and successful content.
Participation Rate Increase
A significant 40% increase in user participation rates was observed when interactive infographics were strategically implemented on social media platforms. This considerable jump was attributed to the innovative use of participation incentives woven seamlessly into the infographics, such as quizzes, polls, or contests. The allure of these incentives encouraged users to engage with the content, thereby boosting participation rates.
Furthermore, the integration of gamification techniques amplified user engagement. By transforming data into an interactive experience, users were driven to participate, explore, and share the content. This modern approach to visualizing information not only made the content more digestible but also increased its viral potential.
Therefore, harnessing the power of interactive infographics on social media platforms can significantly increase user participation.
Case Studies: Successful Use of Interactive Infographics
How have some companies effectively utilized interactive infographics to boost user engagement on social media platforms?
Successful businesses have mastered the art of infographic adaptation and platform suitability.
BuzzFeed: Known for its viral content, BuzzFeed uses interactive infographics to create engaging quizzes and listicles. Their data-driven approach has resulted in increased user interaction and sharing.
The New York Times: This renowned publication uses interactive infographics in their digital storytelling, allowing users to explore data on a deeper level, boosting user engagement and time spent on their platform.
Spotify: The music streaming giant uses interactive infographics to personalize user experience, sharing users' listening statistics in a visually appealing format, resulting in widespread sharing on social media.
These innovative methods underline the potential of interactive infographics in increasing user participation on social media platforms.

Overcoming Challenges in Creating Interactive Infographics
As we navigate the intricate landscape of creating interactive infographics, we encounter several challenges. These challenges include understanding design complexity, mastering technical skills, and managing time and resources efficiently. Each of these elements presents a unique hurdle, but with strategic planning and innovative thinking, they can be turned into stepping stones for success.
Understanding design complexity is crucial in creating interactive infographics. It requires a deep understanding of visual communication principles, data analysis, and storytelling techniques. By investing time in research and studying successful examples, designers can gain valuable insights and develop effective design strategies.
Mastering technical skills is another challenge in creating interactive infographics. Designers need to be proficient in various software tools, programming languages, and data visualization techniques. Continuous learning and staying updated with the latest trends and technologies can help designers overcome this challenge.
Managing time and resources efficiently is essential for creating high-quality interactive infographics. Designers must prioritize tasks, set realistic deadlines, and allocate resources effectively. Collaboration with team members and using project management tools can streamline the workflow and ensure timely completion of projects.
Understanding Design Complexity
In the realm of interactive infographics, grappling with design complexity presents a significant hurdle for many content creators. Understanding the intricate balance between design principles and audience analysis is paramount to overcoming these challenges.
Design Principles: Innovative design is not just about aesthetics; it's about functionality and user experience. Employing principles such as visual hierarchy, balance, and contrast can effectively communicate information and engage users.
Audience Analysis: Understanding your audience's needs, preferences, and behaviors is key. This insight helps to tailor the design and content of your infographics, ensuring they resonate with your audience and encourage participation.
Simplicity: Despite the inherent complexity of interactive infographics, simplicity should be the ultimate goal. Strive for a clean, intuitive design that enhances the user's experience without overwhelming them.
Technical Skill Requirements
Mastering the technical skills necessary for creating engaging interactive infographics is a significant challenge that many content creators face. This journey begins with understanding infographic animation, a powerful tool that brings data to life, making it compelling and memorable.
However, the process can be complex, requiring a deep understanding of various software platforms and coding languages.
Overcoming this hurdle demands continuous learning and a commitment to innovation. Another aspect to consider is content personalization, which allows for a more tailored user experience. This involves leveraging user data to create infographics that resonate on a personal level, thereby boosting engagement.
While demanding, the mastery of these technical skills can significantly enhance the effectiveness of your social media content.
Time and Resource Management
While the technical skillset is a significant facet in creating interactive infographics, managing time and resources efficiently presents another set of challenges that need to be tactfully navigated. This involves a balance of Project Prioritization and Task Delegation.
Three key steps can aid in overcoming these challenges:
Project Prioritization: This involves identifying what tasks are most critical to the success of the infographic project and focusing resources there.
Task Delegation: Efficiently assigning tasks to your team based on their skillsets can greatly improve productivity and ensure quality output.
Continuous Evaluation: Regularly reassess the project's status to keep it on schedule and within budget, while ensuring the end product meets the desired quality.
Innovation in management strategies is as vital as technical proficiency in creating successful interactive infographics.
Five key trends are poised to shape the future of interactive infographics on social media, and understanding these trends could provide valuable insights for increasing user engagement. Infographic monetization is set to play a pivotal role, with businesses leveraging data visualization to drive revenue growth. This trend offers creators an opportunity to monetize their skills while providing valuable content to users.
Moreover, Virtual Reality (VR) infographics are emerging as a game-changing trend. Infographics in VR can immerse users in a 3D data-driven environment, offering a completely new level of interaction. This innovative approach has the potential to boost user participation dramatically.
Staying ahead of these trends will be crucial for businesses seeking to maximize the power of infographics on social media platforms.
Frequently Asked Questions
The costs of developing interactive infographics for social media include purchasing infographic designing tools and potentially outsourcing infographic creation, which can vary depending on complexity, duration, and the expertise of the hired professionals.
Copyright law applies to interactive infographics on social media through potential copyright infringements. Abiding by fair use policies is crucial to avoid legal implications while using others' intellectual property in your infographics.
Yes, interactive infographics can be effectively used across various social media platforms, provided platform compatibility is considered. Each platform has unique specifications that can influence infographic engagement and user interaction.
How Much Time Does It Typically Take to Create an Interactive Infographic?
The time frame to create an interactive infographic varies, typically ranging from a few days to weeks, depending on the complexity of design process and depth of content research required to effectively convey the information.
What Skills Are Required to Create Effective Interactive Infographics?
Creating effective interactive infographics requires a strong understanding of design principles and proficiency in content research. Expertise in data visualization, UX design, and storytelling are also essential to engage and inform the audience innovatively.
 Digital Art InstructionDIY Infographics DesignMobile Game ArtworkPersonalized Logo Design3D AnimationeBook Covers DesignPrivacy PolicyTerms And Conditions