
Innovation in education is pivotal.
Infographics, a blend of information and graphics, play a crucial role in this arena.
This article explores eight distinctive ways to incorporate infographics into educational content, transforming complex data into digestible information, stimulating creativity, and enhancing online learning.
Dive in to discover how infographics can revolutionize teaching approaches, making them more engaging, effective and accessible.
The Power of Visual Learning: Infographics in Education
In the realm of education, 65% of the population are visual learners, indicating the immense potential of infographics as a powerful educational tool. Harnessing this avenue can enhance visual literacy, empowering learners to interpret, negotiate and make meaning from information presented in the form of an image.
Infographics, by their unique blend of text and visuals, serve as compelling mediums for conveying complex information in a digestible format. The process of infographic assessment further provides educators with valuable insight into a student's comprehension and interpretative abilities.
By integrating infographics into education, we are acknowledging the changing learning preferences, and paving a path towards a more innovative, engaging, and effective learning environment.
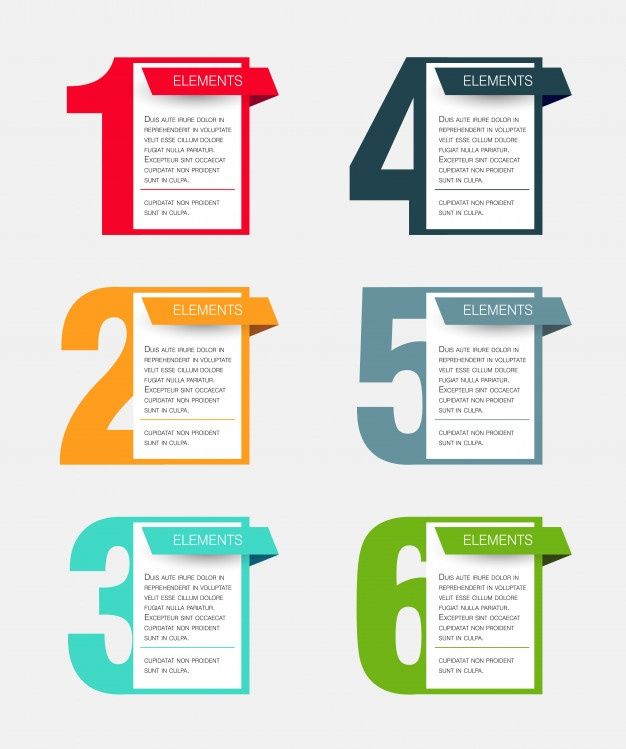
Infographics are not just an innovative tool, but a revolutionary stride in education.
A significant challenge in education is presenting complex data in a manner that is easily comprehensible. This is where the power of infographics comes into play, transforming intricate information into visuals that are both engaging and simple to grasp.
Through this transformation, educators can enhance learning experiences, making the absorption of complicated data more seamless for students.
Simplifying Data Visualization
While infographics are visually appealing, their true power lies in their ability to transform complex data into easily understandable visuals. This process, often termed as data simplification, involves the use of various techniques and infographic design principles to make information more digestible for the audience.
Data Chunking: Breaking down complex information into smaller, manageable parts. This makes the data easier to process and understand.
Use of Visuals: Instead of presenting bare numbers and statistics, infographics make use of visuals. Graphs, charts, and images make the information more engaging and comprehensible.
Hierarchy of Information: Important data points are highlighted and less important ones are subdued. This prioritization helps in focusing attention on key insights.
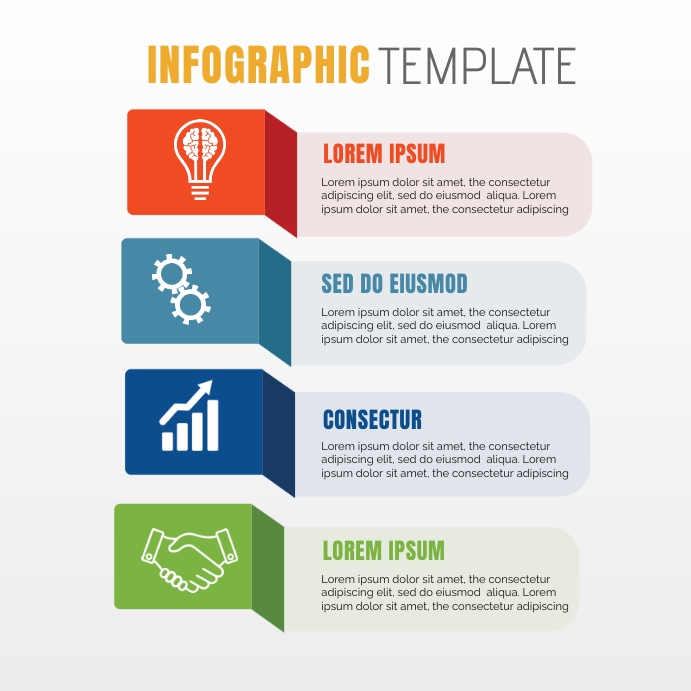
Infographics in Education
Over the course of recent years, educators have increasingly turned to infographics as a tool for education. The transformation of complex data into simple visuals has become an integral part of this process. This innovative method enhances infographic accessibility, making dense information digestible and engaging for students.
Through the use of appealing graphics and concise text, infographics can help illuminate patterns, trends, and correlations that might be overlooked in traditional text-based content. However, there are also infographic limitations to consider. The oversimplification of data can sometimes lead to the omission of crucial details. Furthermore, creating comprehensive and accurate infographics requires a skilled balance between aesthetic appeal and factual representation.
Despite these challenges, the benefits of using infographics in education are undeniable.
Infographics as Interactive Study Guides
With the evolution of digital learning, infographics have emerged as powerful interactive study guides.
Their visually appealing designs simplify complex information, making them effective tools for enhancing comprehension and retention.
Moreover, their interactive nature not only engages students more but also facilitates active participation, transforming the usual monotonous study routine into an engaging learning experience.
Creating Interactive Infographics
The educator's task of creating interactive infographics can revolutionize the students' experience with study guides by making them more engaging and visually stimulating. Infographic accessibility and the use of infographic creation tools can transform traditional study materials into interactive, visually appealing content.

Infographic Accessibility: Making infographics that are easily accessible online or offline enhances the learning experience. This includes adjusting the design for different screen sizes and ensuring compatibility with assistive technologies for learners with disabilities.
Infographic Creation Tools: Innovative tools like Canva, Piktochart, and Adobe Spark empower educators to create dynamic infographics. No design skills are required, only creativity and a willingness to explore.
Interactive Elements: Adding clickable links, videos, or quizzes to infographics makes studying more engaging and fun. These additions can aid in reinforcing the material and testing comprehension.
Study Guide Benefits
In our discussion of infographics as interactive study guides, we recognize the significant benefits they offer to both educators and students. The innovative guide design of infographics presents complex data in a visually engaging and easy-to-understand format. This not only aids in better information retention but also fosters a more interactive learning experience.
Properly designed infographics provide an efficient way to simplify complicated concepts, making them more accessible and stimulating for students. This is a testament to the infographic efficacy in educational settings. Infographics can also encourage self-paced learning, allowing students to absorb information at their own speed.
Student Engagement Increase
Numerous studies have shown that student engagement increases significantly when infographics are used as interactive study guides. This increase is not only in terms of content understanding but also in terms of interest and enjoyment in the learning process.
With the right use of infographics, educators can facilitate a more immersive learning experience. Here are three ways infographics boost engagement metrics and act as effective motivational tactics:
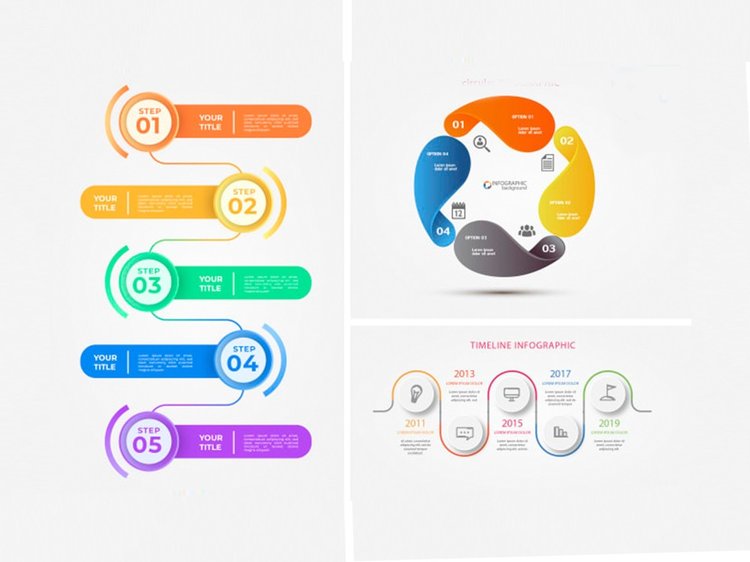
Infographics simplify complex topics, making them more accessible and engaging, thereby increasing understanding and retention.
Interactive infographics offer an element of exploration, which stimulates interest and encourages students to dive deeper into the content.
The visual nature of infographics caters to visual learners, enhancing their learning experience and overall engagement.
Enhancing Classroom Presentations With Infographics
Educators' utilization of infographics can significantly enhance the quality and engagement level of their classroom presentations. Infographics, when created with robust Infographic Designing Tools, can transform complex data into easy-to-understand visuals.
They can engage students by encapsulating large volumes of information in a digestible format, thereby making learning more interactive. Particularly in the realm of Special Education, infographics have the potential to revolutionize teaching strategies. They provide an alternative learning medium that can be tailored to individual learning needs, making content more accessible.
The combination of text and visuals aids in reinforcing concepts, promoting better understanding and retention. Hence, infographics are not merely tools for presentation enhancement, but a catalyst for educational innovation.
Using Infographics to Encourage Student Creativity
How can the use of infographics in the classroom not only facilitate learning, but also stimulate and enhance student creativity?
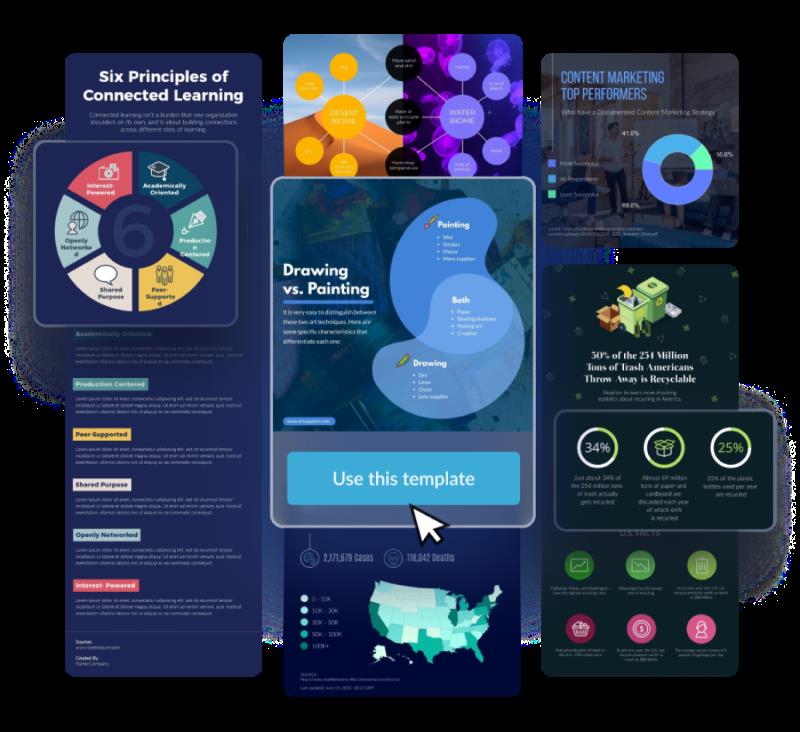
Infographics, through their visually engaging nature, can be a powerful tool to foster creative thinking and problem-solving skills among students. They provide an opportunity to represent complex information in a simplified and comprehensible manner.
Infographic Assessment: Assigning students the task of creating their own infographics for a project can support creative expression and critical thinking. It provides a platform for students to showcase their understanding in a visually appealing manner.
Infographic Design Techniques: Teaching students various design techniques can encourage them to think creatively and innovatively.
Integration with Other Media: Infographics can be combined with other multimedia resources to create dynamic and engaging presentations, further encouraging student creativity.
Infographics for Teaching Abstract Concepts
While many may believe that infographics are primarily used for representing concrete data, they can also be astoundingly effective when used to teach abstract concepts in the classroom. The efficacy of an infographic in this context is determined by its design principles.
The choice of colors, typography, and layout play a crucial role in simplifying complex, abstract ideas. The limitations of infographics, such as the risk of oversimplification and misinterpretation, should be thoughtfully considered. However, when designed well, infographics can illustrate connections, hierarchies, and processes in a way that text alone cannot.
They provide a visual language that can help students grasp abstract concepts, sparking curiosity and encouraging deeper understanding.
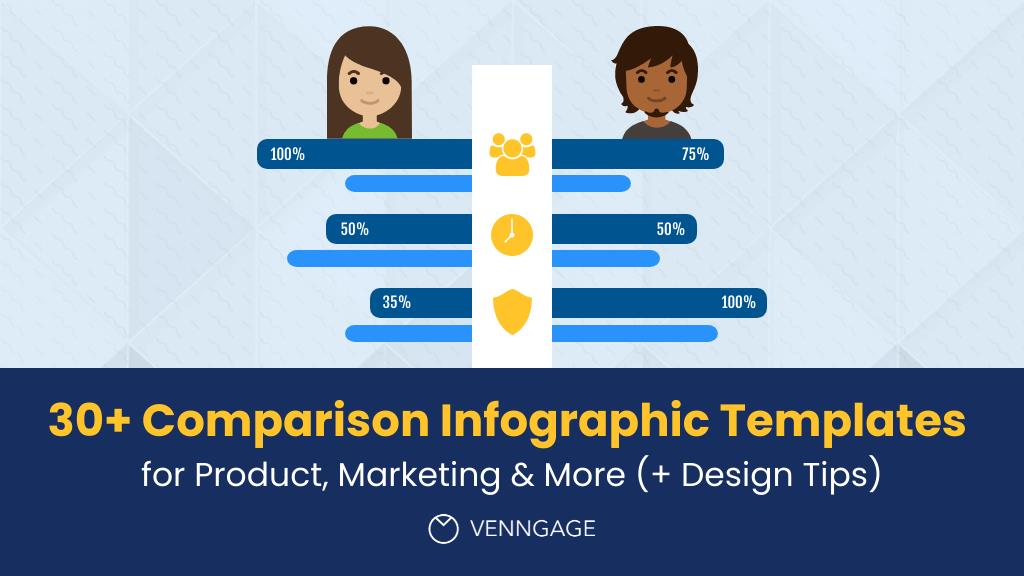
Interactive Infographics for Online Learning
In the realm of online learning, interactive infographics serve as powerful tools for enhancing student engagement and facilitating comprehensive understanding. These visually appealing, data-driven tools transform complex information into digestible content, fostering an educational environment that is both engaging and accessible.
Infographic Gamification: By incorporating game-like elements, interactive infographics can increase student motivation and promote active learning.
Infographic Accessibility: Optimized for various platforms and assistive technologies, these infographics ensure that all students, regardless of their abilities or resources, can benefit from the learning material.
Customizable Learning Paths: Interactive infographics can adapt to individual learning styles and paces, providing personalized education experiences.
Adopting interactive infographics in online learning platforms encourages innovation, enhances comprehension, and promotes inclusive learning.
Case Studies: Successful Use of Infographics in Education
Numerous case studies, coupled with extensive educational research, illustrate the transformative impact of infographics on teaching and learning methodologies.
These studies highlight the infographic effectiveness in simplifying complex concepts, fostering student engagement, and promoting critical thinking.
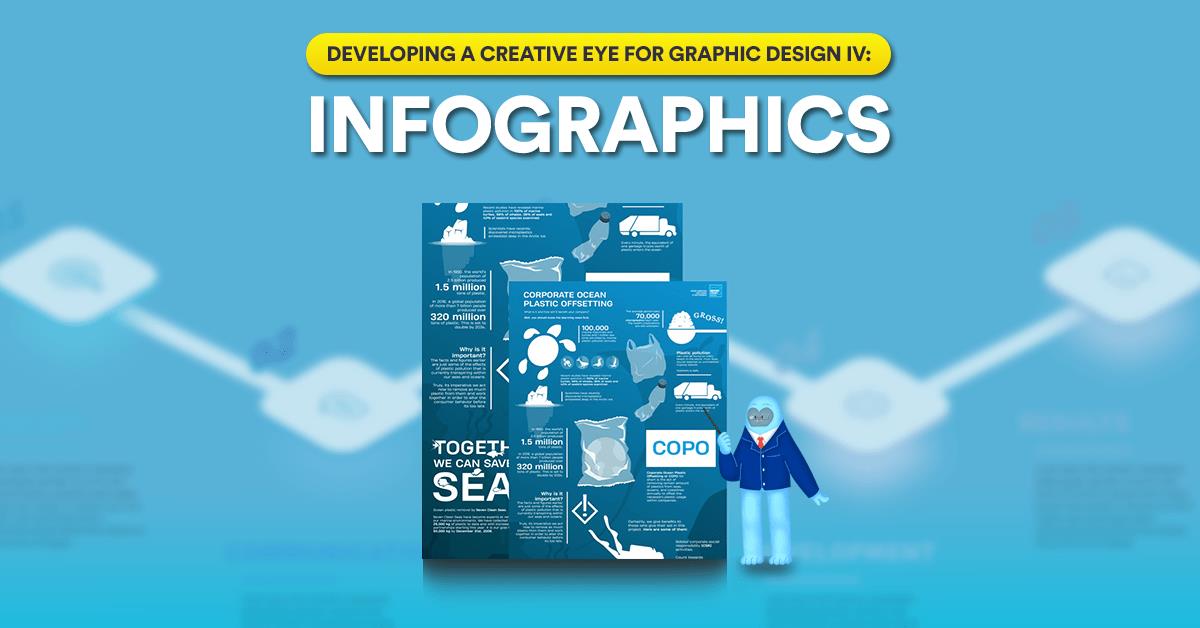
One notable case study involves a high school in California that incorporated infographics into their science curriculum. This innovative approach resulted in a marked improvement in student understanding and retention of complex scientific processes.
The pedagogical benefits were evident as students not only performed better in assessments, but also demonstrated an increased interest in learning.
This underscores the potential of infographics as powerful educational tools.
The success of these case studies provides a roadmap for educators seeking innovative ways to enhance their teaching strategies.
Frequently Asked Questions
What Are Some Potential Challenges or Limitations in Using Infographics for Educational Content?
Potential challenges in using infographics for educational content include ensuring infographic accessibility for all learners and maintaining cultural relevance, considering diverse interpretations and understanding across different cultures and backgrounds.
Can Infographics Be Used Effectively for Every Subject Matter or Are They More Suited to Certain Topics?
Infographics, with their graphic simplicity, can be customized to suit any subject matter. However, they are particularly effective for topics that involve data, processes, or concepts that can be visually represented for easier understanding.
How Can Educators Assess Student Understanding or Knowledge Gain From Using Infographics?
Educators can assess student understanding from infographics through methods such as quizzes, discussions, and projects that require interpretation of infographic design. High student engagement often indicates effective knowledge gain from this visual tool.
To create accessible and interactive infographics, educators can utilize software such as Canva, Piktochart, or Venngage. These tools offer innovative, user-friendly platforms to present information in a visually engaging and informative manner.
The effectiveness of infographics as a teaching tool can be gauged by measuring audience engagement metrics. Adherence to infographic design principles and resultant learner interaction levels provide key insights into their educational impact.
 Digital Art InstructionDIY Infographics DesignMobile Game ArtworkPersonalized Logo Design3D AnimationeBook Covers DesignPrivacy PolicyTerms And Conditions
