
In the dynamic digital age, infographics have emerged as a compelling tool for brand storytelling. By transforming complex information into visually engaging narratives, they enhance audience engagement and highlight unique selling points.
This article explores eight strategic ways in which infographics revolutionize brand storytelling. It discusses how infographics can be integrated into SEO and social media strategies to maximize their impact. Additionally, it provides insights into future trends in the field of infographics and brand storytelling.
Get ready to harness the power of visual data to effectively communicate your brand's story.
The Power of Visual Data in Storytelling
In the realm of brand storytelling, the power of visual data cannot be underestimated, providing a compelling and efficient way to communicate complex information. Visual literacy is increasingly important in the digital age, allowing brands to convey their narrative in innovative and accessible ways.
Infographics, for instance, utilize design aesthetics to translate statistics and facts into dynamic visual narratives. They engage the audience, making dense or abstract data more digestible and fun. They also enhance brand image, imbuing it with a modern, forward-thinking persona, appealing to an audience that craves innovation.
Visual data, when used strategically, can significantly elevate brand storytelling, creating a more immersive, interactive experience for the consumer. It's not just about telling a story; it's about painting a picture.
Infographics, with their visually compelling narrative, serve as a powerful tool in simplifying complex information.
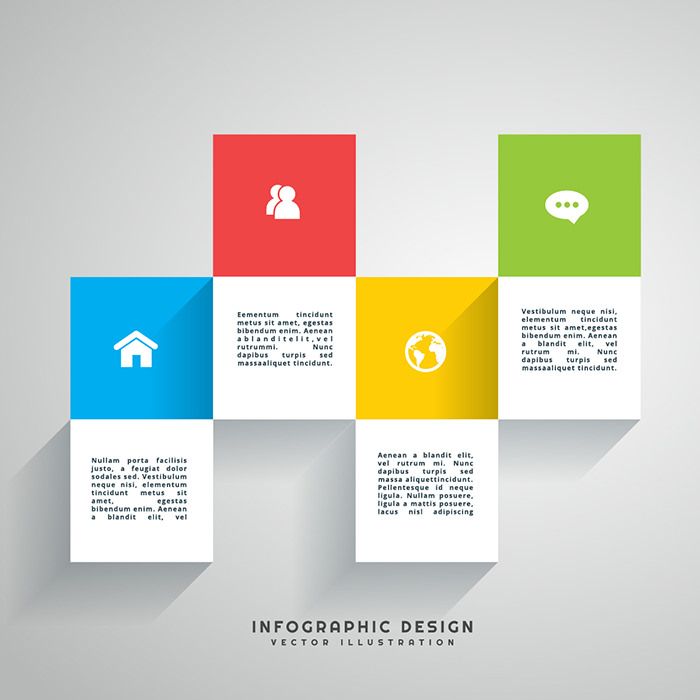
We will now explore how the use of infographics can transform intricate data into a straightforward, engaging story that can be easily understood by the audience.
This strategic approach not only enhances the clarity of the message but also contributes significantly to the efficiency of brand storytelling.
Complexity Reduction Techniques
Leveraging the power of visual representation, infographics break down complex information into easily digestible, simplified visuals, thereby revolutionizing brand storytelling.
The complexity reduction techniques employed in infographic design are clever, strategic, and innovative. They utilize the principles of color psychology to convey information in a way that resonates with the audience on both a cognitive and emotional level. The use of colors, shapes, and patterns in infographics not only simplifies the information but also creates an engaging visual narrative that can effectively communicate a brand's story.
This innovative approach to data visualization helps to eliminate information overload, making complex data more comprehensible and memorable. Infographics thus serve as a powerful tool for brands to simplify their complex narratives, engage their audience, and enhance their storytelling.
Infographics: Simplified Storytelling
Through the use of clear visuals and concise text, infographics simplify complex information, and in doing so, they revolutionize the way brands tell their stories. They harness the power of Infographic Psychology, taking advantage of our brain's propensity for visual stimuli. This allows consumers to digest and retain information more effectively, fostering a deeper connection with the brand's narrative.
Furthermore, Infographic Metrics provide actionable insights into user engagement and interaction, guiding brands in strategically crafting their stories. The beauty of infographics lies in their versatility, from presenting data-heavy research to illustrating workflows or processes. This innovative tool enables brands to distil intricate narratives into digestible, engaging content, thereby redefining storytelling in the digital age.
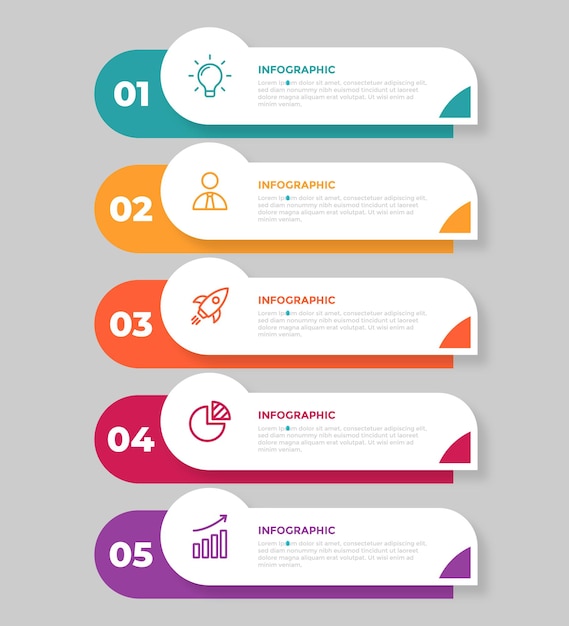
Enhancing Audience Engagement Through Infographics
By utilizing infographics, brands can significantly increase their audience engagement, tapping into the power of visual storytelling for effective communication. A well-crafted infographic design can effectively distill complex information into digestible, visually appealing content. This strategy not only captivates the audience but also boosts retention rates.
Audience targeting becomes remarkably efficient as infographics can be tailored to appeal to different demographic or psychographic segments. These visual tools can convey a brand's unique narrative, core values, or data-driven insights in an innovative and memorable way.
Brands that leverage infographics can expect a surge in audience engagement, fostering greater brand awareness, affinity, and ultimately, loyalty. Thus, infographics are a powerful weapon in a brand's storytelling arsenal, revolutionizing the way they connect and communicate with their audiences.
Using Infographics to Highlight Unique Selling Points
Infographics serve as a compelling platform for brands to showcase their unique selling points, transforming abstract concepts into visually engaging narratives. Through strategic infographic designing, businesses can highlight their strengths and distinguish themselves from competitors in a way that significantly influences brand perception.
- Infographic Designing:
- Simplicity: Complex data is distilled into digestible, visually striking formats.
- Brand Relevance: The design aligns with the brand's identity to maintain consistency.
- Innovation: Unconventional representations break the monotony, sparking interest and curiosity.
This strategy is not only engaging and informative but also fosters an innovative image for the brand. The power of infographics lies in their ability to tell a brand's story in a unique and compelling way. Consequently, they play a pivotal role in shaping the brand's narrative and defining its unique selling points.
The integration of infographics with social media platforms presents a potent blend for brand storytelling. By boosting audience engagement, exploiting the viral potential of social media, and visually representing data, infographics can significantly amplify a brand's narrative.
This combination not only makes information more digestible, but also enhances its shareability, thereby expanding the brand's reach.
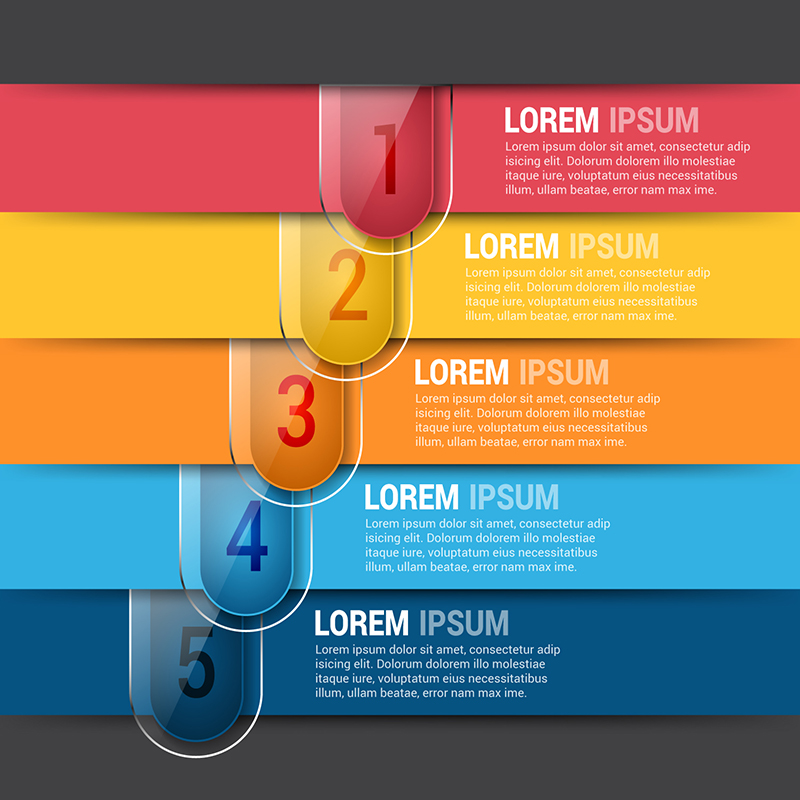
Boosting Engagement
Utilizing a strategic blend of infographics and social media can increase user engagement by up to 200%, making for a truly powerful marketing combination. The use of interactive infographics encourages user participation, creating a more engaging and memorable brand experience.
- Three ways to boost engagement include:
- Developing interactive infographics that invite users to manipulate data and visuals, fostering a sense of participation and immersion.
- Sharing these infographics across various social media platforms to reach a broader audience, thus increasing visibility and interaction.
- Encouraging user participation by prompting discussions, questions, or sharing of the infographics. This not only boosts engagement but also cultivates a sense of community around your brand.
This innovative approach to marketing can revolutionize brand storytelling, making it more dynamic, engaging and impactful.
Leveraging Virality
Often, businesses overlook the power of virality, but when paired with infographics, social media becomes a potent tool in disseminating brand narratives swiftly and widely. Infographic elements such as compelling visuals, concise data, and engaging narratives are designed to capture attention and encourage sharing, thereby driving virality.
Combining these with the vast reach of social media channels can amplify your brand's story, making it resonate with a larger audience. Monitoring virality metrics, such as shares, likes, comments, and reposts, gives a clear understanding of how well the infographic is performing. By analyzing these metrics, you can refine and optimize your content to increase its virality potential.
Therefore, leveraging the synergy between infographics and social media can revolutionize brand storytelling, making it a game-changer in the digital marketing landscape.
Data Visualization Impact
Regularly incorporating infographics into your social media strategy can significantly enhance the impact of data visualization, making complex information more digestible and shareable for your audience. This potent combination offers an innovative approach to data interpretation, transforming raw data into engaging, informative visuals through infographic analysis.
Consider the following benefits of integrating infographics with your social media strategy:
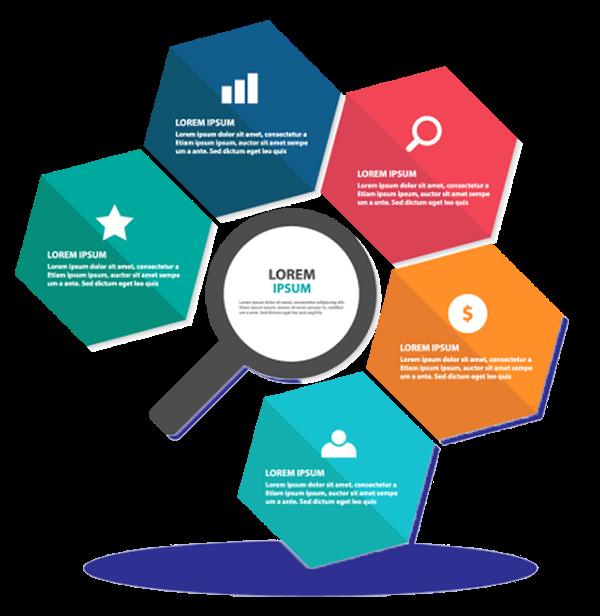
Enhanced Data Interpretation:
Transforms complex statistical data into easily understandable visuals.
Facilitates quicker comprehension and retention of information.
Improved Infographic Analysis:
Allows for the identification of patterns and trends.
Simplifies complex information, making it more accessible.
Increased Engagement on Social Media:
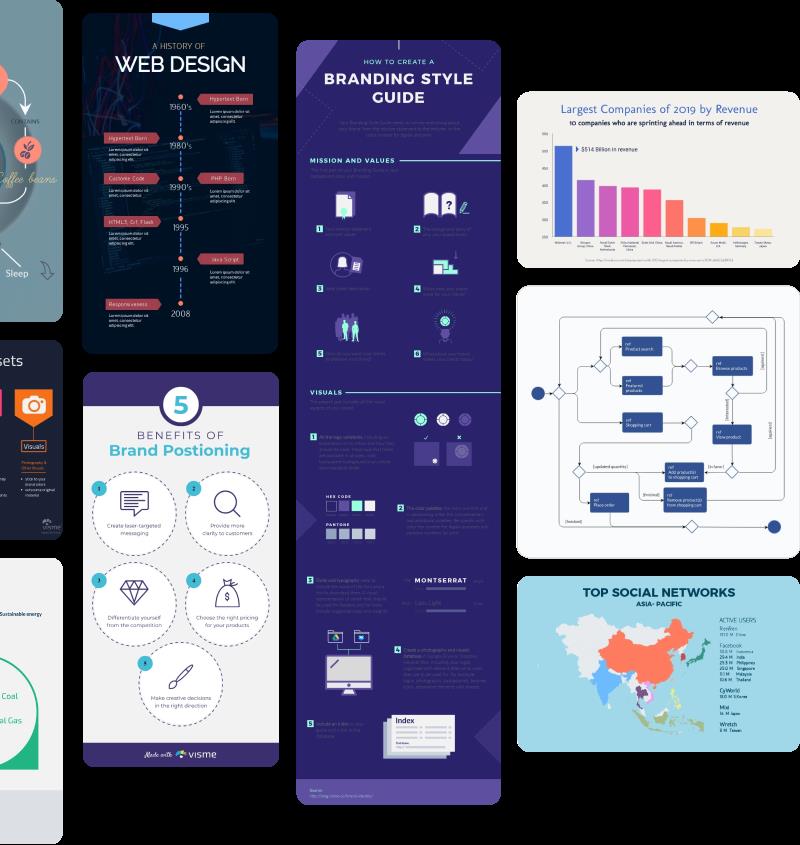
Engages audiences with visually appealing content.
Encourages more shares, likes, and comments, enhancing your brand's reach.
This innovative approach can significantly revolutionize your brand storytelling, making it more impactful and memorable.
The Role of Infographics in SEO Strategy
Incorporating infographics into an SEO strategy can significantly enhance a brand's online visibility and engagement. Infographics, when used effectively, can lead to SEO rankings improvement by providing high-quality, relevant content that can be easily shared and linked back to your website.
The rich, visual nature of infographics makes them an excellent tool for image optimization techniques, benefiting both user experience and search engine recognition. These graphic elements can be tagged with SEO-friendly metadata, further boosting potential visibility in image search results.
Case Study: Successful Brands Using Infographics
Several brands have leveraged the power of infographics for storytelling and, in the process, achieved remarkable success. These brands have utilized infographic design principles to effectively illustrate their brand evolution depiction, captivating their audiences with visually appealing and informative content.
Brand A
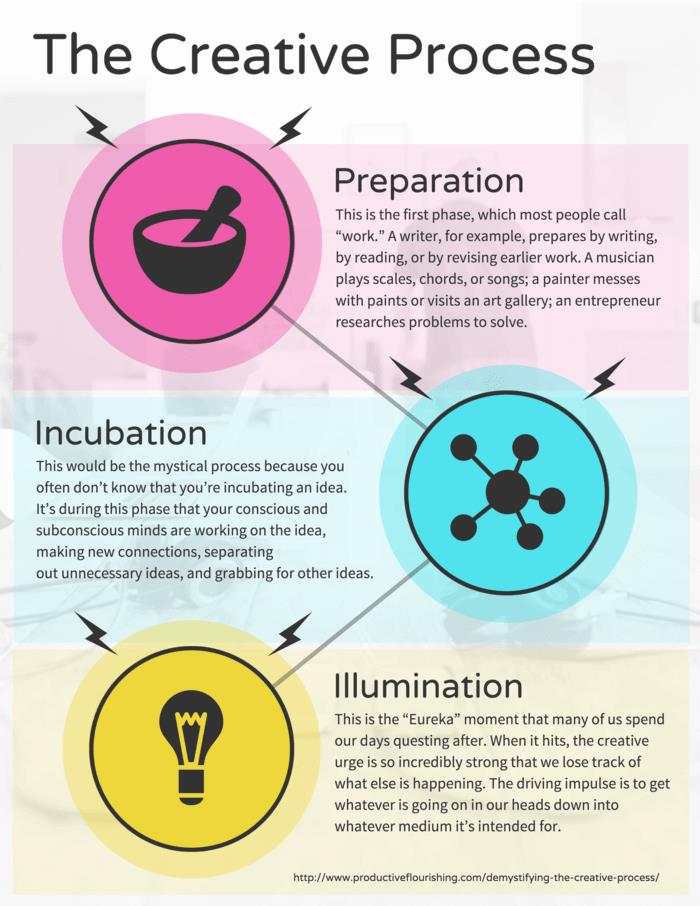
Used infographics to showcase the timeline of their brand evolution, highlighting key milestones and achievements.
Infographic design principles were applied to ensure the information was easily digestible and engaging.
Brand B
Emphasized the impact of their services on customers through infographics, making their success tangible.
Utilized innovative design elements to keep the audience engaged.
Brand C
Presented complex data in a simplified, visual format, making their brand story clear and compelling.

The design was strategic, ensuring the infographic accurately represented their brand identity.
Future Trends in Infographics and Brand Storytelling
As we delve into the future trends in infographics and brand storytelling, it's essential to understand that these trends are not merely fleeting fads, but rather, strategic shifts that are shaping the way businesses communicate their brand narratives.
The infographic evolution is moving towards more interactive and immersive experiences, utilizing cutting-edge technologies such as AR and VR. These advancements allow for the creation of dynamic and engaging content that truly resonates with audiences, effectively establishing brand identity through infographics.
Furthermore, big data and AI are also transforming the infographic landscape, providing insightful, data-driven visuals that help brands tell their stories more effectively.
These trends signify an exciting future for infographics and brand storytelling, opening new avenues for brands to engage, inform, and connect with their customers.
Frequently Asked Questions
How Much Does It Typically Cost to Produce a Professional Infographic?
The cost of producing a professional infographic can vary significantly, typically ranging from $200 to $2000. Factors influencing the expense include design complexity, data research, and whether outsourcing infographics production for optimal Infographic ROI.
In the realm of Infographic Design Basics, software tools like Adobe Illustrator, Canva, and Piktochart are recommended. When Choosing Colors for Infographics, these platforms offer versatile palettes to enhance visual storytelling effectively.
How Can I Measure the Effectiveness of My Brand's Infographics?
The effectiveness of your brand's infographics can be measured through Infographic Analytics, primarily focusing on viewer engagement. This includes tracking views, shares, likes, comments, and the overall time spent interacting with the infographic.
Are There Specific Industries or Sectors Where Infographics Are More Effective?
Yes, specific industries find infographics particularly effective. Notably, Infographic Utilization in Healthcare simplifies complex data for patients, while Infographics in the Education Sector enhance learning by making information more digestible and engaging for students.
How Can I Ensure My Infographics Are Accessible for People With Visual Impairments?
To ensure infographics accessibility for visually impaired individuals, consider the importance of color contrast and the exploration of tactile graphics. High contrast colors aid visibility, while tactile graphics offer a touchable interpretation of data.
 Digital Art InstructionDIY Infographics DesignMobile Game ArtworkPersonalized Logo Design3D AnimationeBook Covers DesignPrivacy PolicyTerms And Conditions
